 Frank Danielson
IG: @frankdanielson66
Perivale Gallery
We built Inukshuk Capital Management to serve the needs of clients looking for a unique approach – void of conflicts of interest, commission sales and pushed products. We began by putting our own money where our mouth is. With low fees and active risk management, we help families achieve financial longevity, that’s the bottom line.
Stay up-to-date on the latest developments by following us on LinkedIn here.
June 2021- Mosaics and Prices
In this issue:
- Global Equity Markets
- Nobody Knows Nuthin
- Inflation – Academics vs the Normies
- Health is Wealth
- The Future of Travel
GLOBAL EQUITY MARKETS
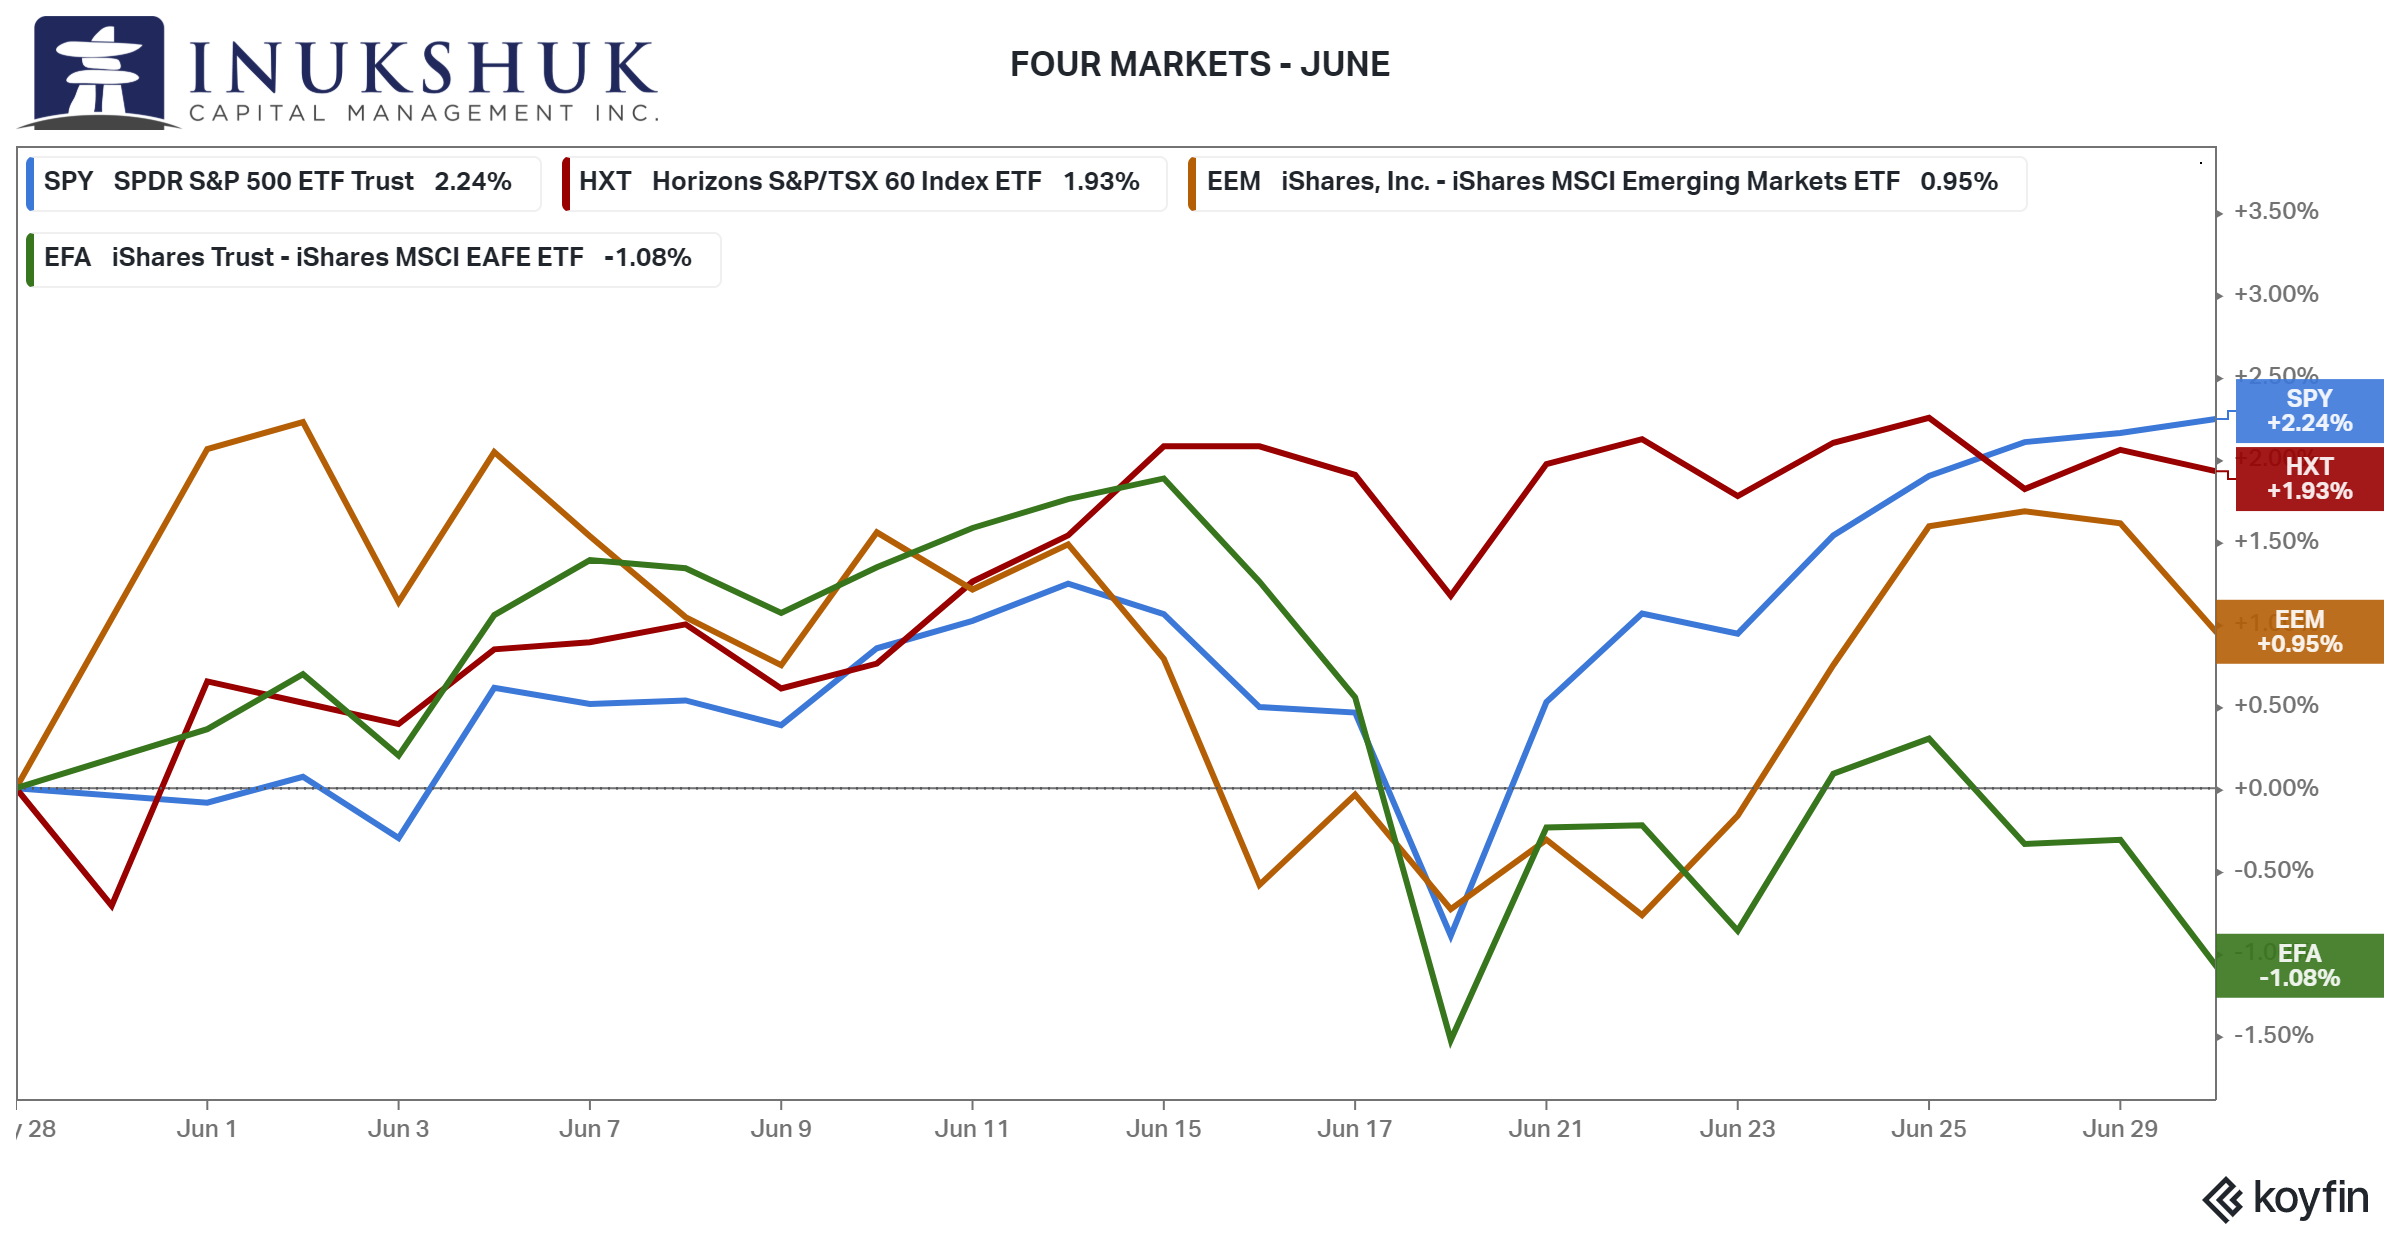
Sometimes this market feels as though the ‘Costanza’ strategy is the best one, then days later – not so much. The S&P/TSX 60 continues to be the leader, while other global equity indexes are all over the place on a month-to-month basis. In May, MSCI EAFE (Europe, Australasia and the Far East) and Emerging Markets (EM) were keeping up with Canada and then in June, they were not. In May the S&P 500 was the underperformer, but in June it was the winner.
This is all occurring while the S&P 500, S&P/TSX 60 and MSCI EAFE made new all-time highs. Similar to May, but the enthusiasm that usually accompanies new highs seems a bit lacking. EAFE closed down on the month 1.0%.
 On the year, the S&P/TSX 60 is leading the pack with gains of almost 20.0%. On the other side, EM is the laggard with gains of just 4.6%.
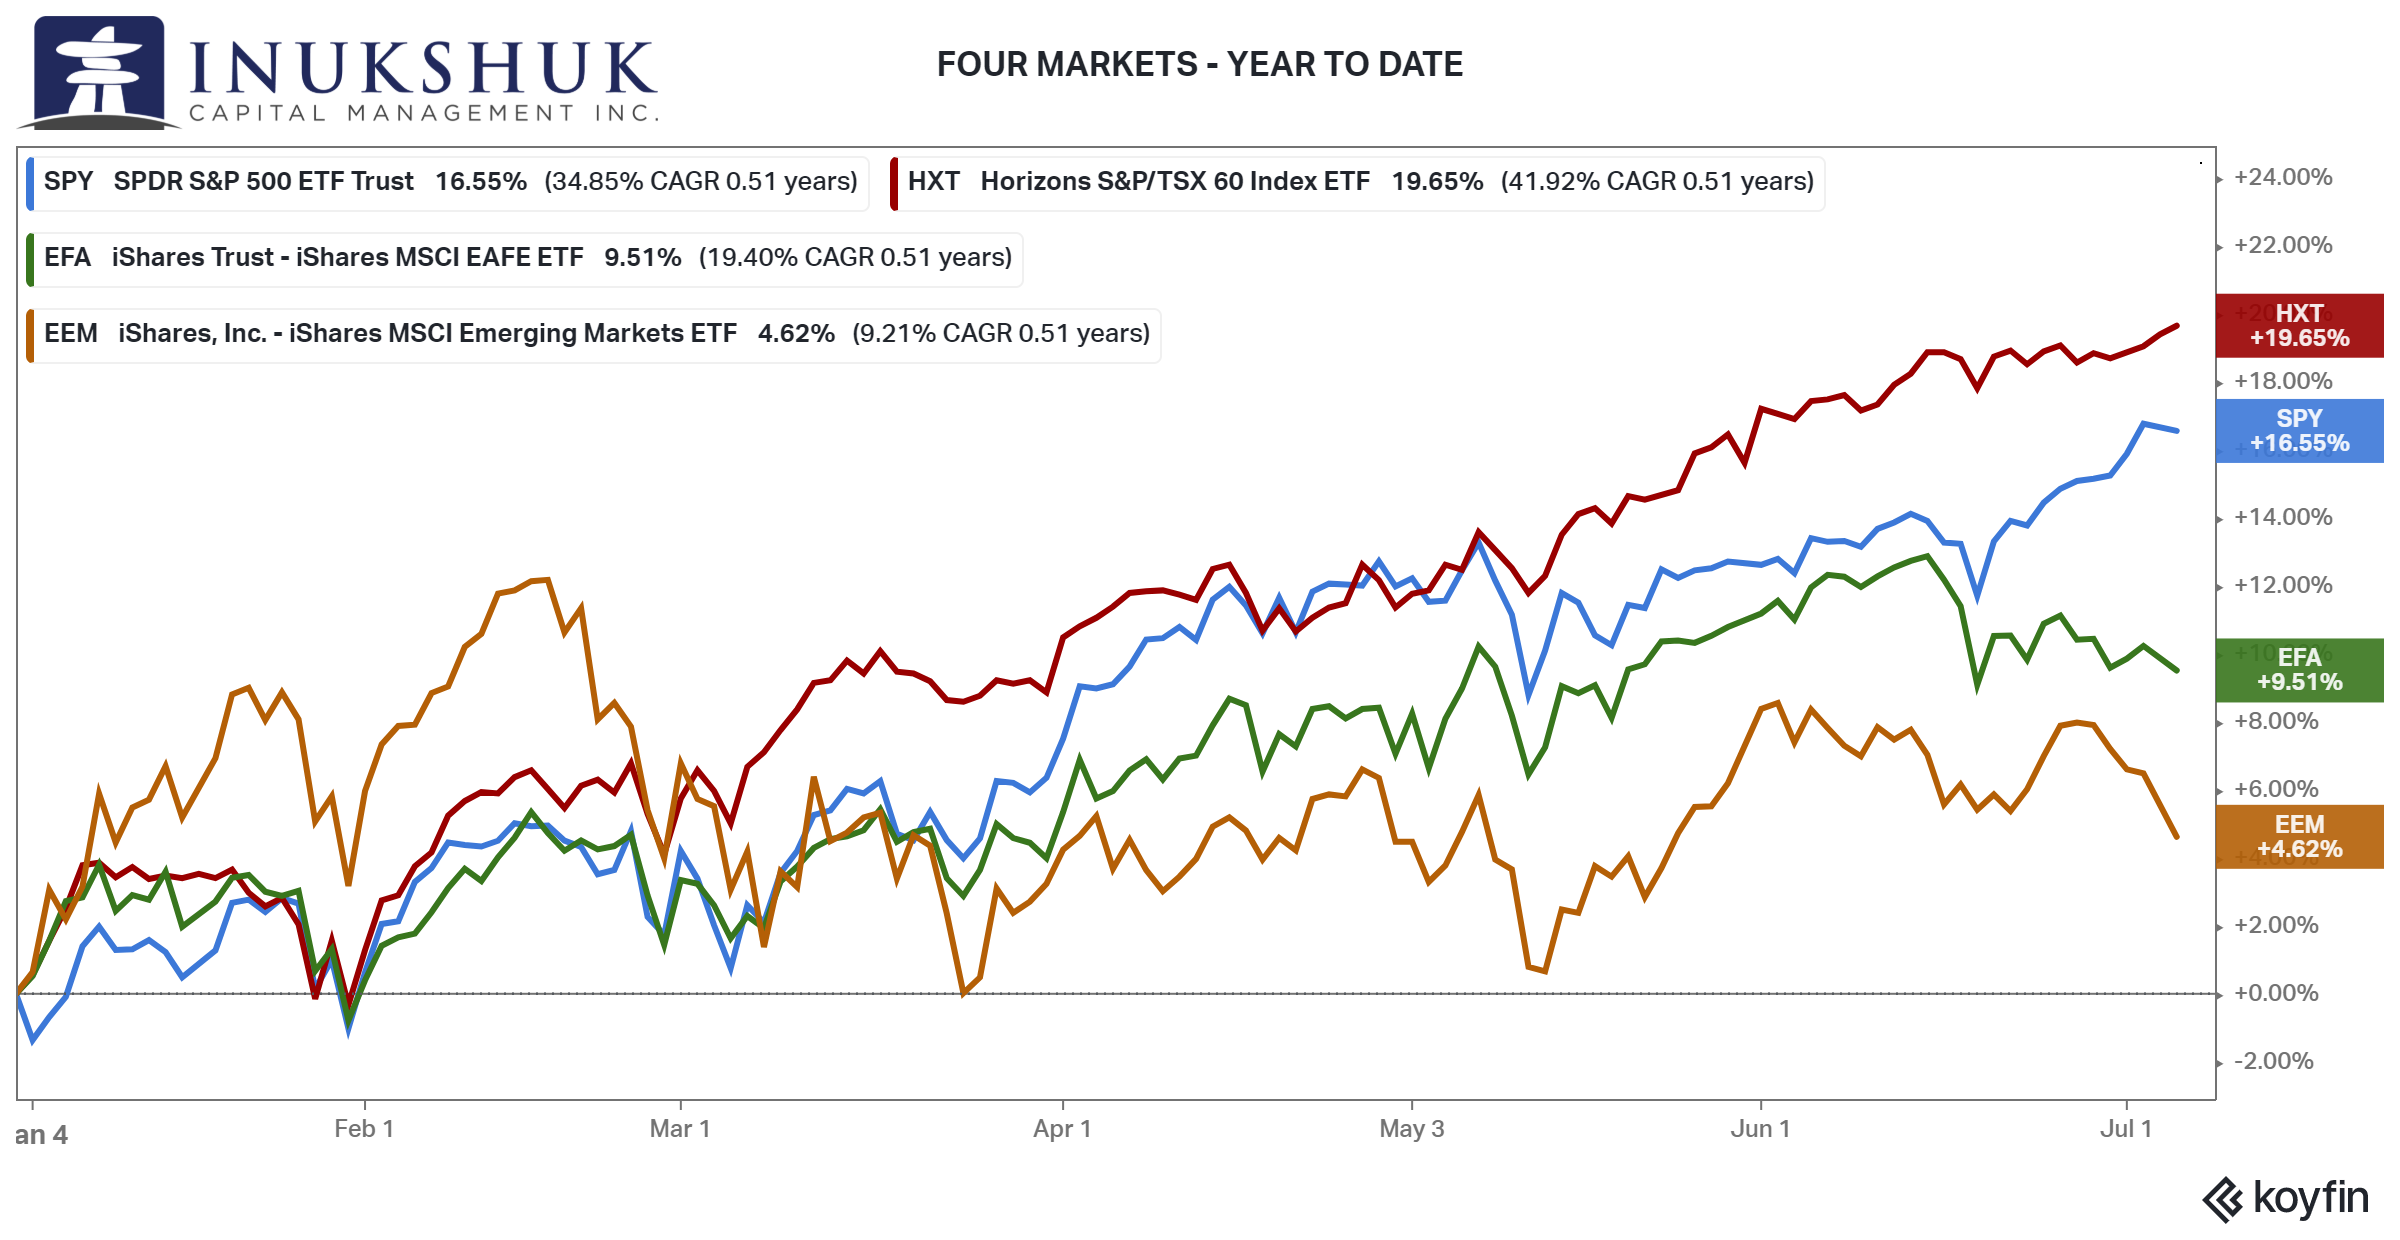
ICM’s positioning across global equity markets added to EM. That was the only change. Otherwise, our active risk management program has had no position in MSCI EAFE since mid-February and allocations to the S&P 500 and S&P/TSX 60 remain at 100%.
In last month’s letter, we observed that neither the Nasdaq 100 nor US small-caps have done anything since February. The latter remains true, but the Nasdaq 100 broke out of its range to new highs in June, up 6.2% on the month, almost doubling its year-to-date return.
If you would like to stay current on our measures of trend and momentum in the markets we follow, please click here.
NOBODY KNOWS NUTHIN
Inukshuk is not in the business of using fundamental analysis to make investment decisions. We use price to guide our asset allocation. That does not mean we are unaware of the prices being paid for assets relative to some theoretical value. There are a few prominent themes in financial Twitter and media that have recently caught the attention of the humans who are interested in markets – valuations and inflation. Let’s look at valuation first.
A common measure of what any stock might be worth is the P/E ratio – or price-to-earnings. The idea being, if a company is earning X dollars per share, perhaps a reasonable price to pay is some multiple of that amount. Earnings announcements are broadcast with great fanfare and much subsequent analysis. Everyone needs to talk about something. A story is good to have if you don’t know what is going on. Also, it is a fact that earnings surprises can generate both positive and negative extreme moves. But they wouldn’t be surprises unless… you get the point.
And those surprises can move entire markets if the company in question is a leader in any one sector of the economy. But remember, a P/E is simply the price of a stock divided by the company’s earnings per share. One of the games in fundamental research is to identify a situation everyone else is missing in a corporation’s earnings potential or lack thereof. Let’s try a thought experiment called – nobody knows nuthin.
In this experiment, the assumption is made that earnings are earnings as reported, and that the prognosticators aren’t that good at guessing what those will be. So, let’s say company ABCD is making an accounting-determined $2 per share on an annualized basis. Some sell-side analysts think next year it will be $3 and others think it will be the same or maybe lower (but that is unusual). In the meantime, the price of the stock is all over the place. Remove the earnings part and you have the price. And the price is driven by millions of different bits and bytes (and now terabytes) of knowledge, personal preferences or maybe a meme with a cat that loves this stock and has laser eyes.
Not everyone involved in this experiment has access to the same information. Also, exclude preferences – for example, you own a stock and need to sell it because the renovation you are doing is over-budget and you are out of cash. That kind of trade-flow information is of low value. But keep the cat meme, for fun.
There is some interesting analysis of public disclosures of US politicians’ trading activity. Senators or representatives can, and do, receive information in their regular duties that others aren’t privy to. There is evidence from mid – February 2020, for example, that suggests some politicians with early knowledge of the potential harm the virus policy response would have on the economy, were selling stocks. Recently it has been disclosed that Nancy Pelosi’s husband is a very good options trader. This is politely described as: asymmetric information.
The point being, earnings can be whatever a group of analysts think they are but the price of any stock is driven by a myriad of potential information or misinformation and how those who have it, act.
So, if the financial pundits and talking heads in the media are saying things are overpriced and ‘bubble-like’ it is hard to know how to measure that. Some things in financial markets occur that seem utterly illogical to observers and participants. It is difficult to determine if any human has ever accurately called the top of a bubble. But, it is clear that many have either been carried-out for betting against a bubble too soon or did not participate and lost their clients and employment. It’s a tough world out there.
Back to price, again. The Nasdaq 100 is up 111% since the Pandemic Panic Low (PPL™). That is a solid return if you were lucky or smart enough to buy the dead-low. Here is another thought experiment. Pick a random number of days prior to the Nasdaq 100 bubble high on March 27, 2000 and compare it to 2020-2021. In this example, we use 100 trading days.
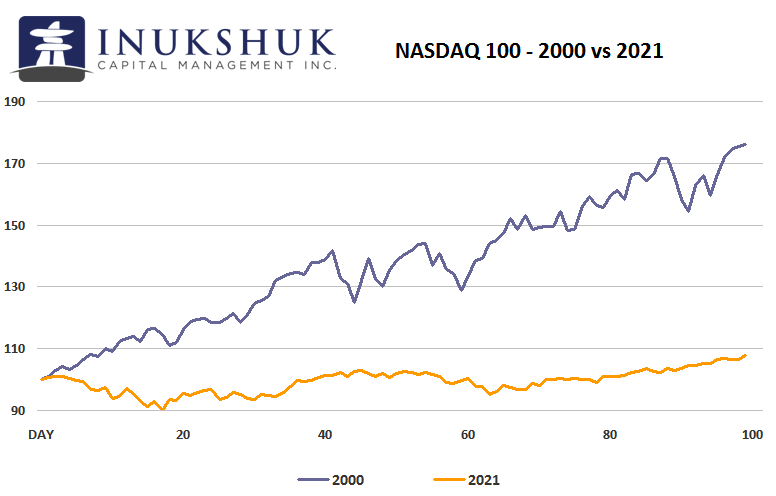
For 2021, 100 days is the middle of February and in 2000 it was early November 1999. It is pretty clear that the old Nasdaq bubble is killing it compared to this current one (if it is indeed a bubble). If you do this experiment over many different timeframes the result is roughly the same. The Nasdaq in the late 1990s to March 2000 was on fire.
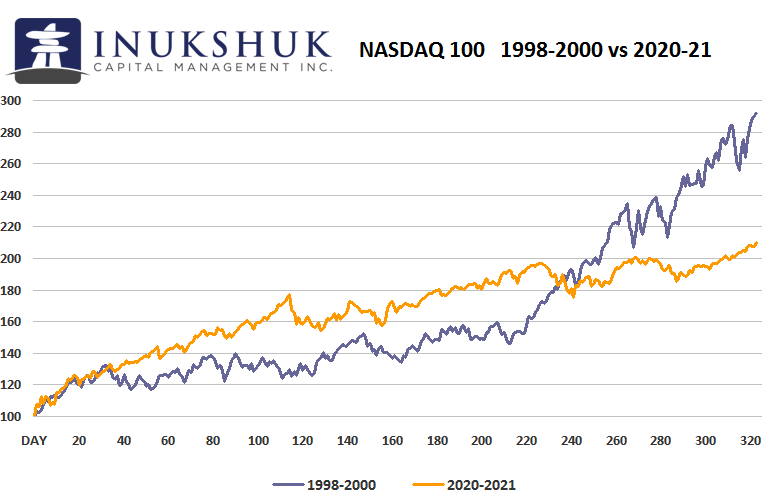
Now, let’s flip it around. What if we counted the number of trading days since the March 20, 2020 low and applied that same number of days back from the 2000 high. That is 324 days. In other words, pick the most recent best time to buy the Nasdaq 100 and then compare that to buying the Nasdaq 100 the same number of days prior to the previous all-time-high in 2000.
Note that both experiments are not p-hacking or goal-seeking. There was never any hypothesis. This is the kind of work we do to inform us as to what has happened and might be possible. To further reiterate, we don’t build systems to manage asset allocation investment decisions based on thought experiments.
Finally, let’s look at the performance from the Global Financial Crisis (GFC) low in March 2009 (March again… interesting, with significant highs and lows) to the same number of trading days from the PPL™ in March 2020 to now.
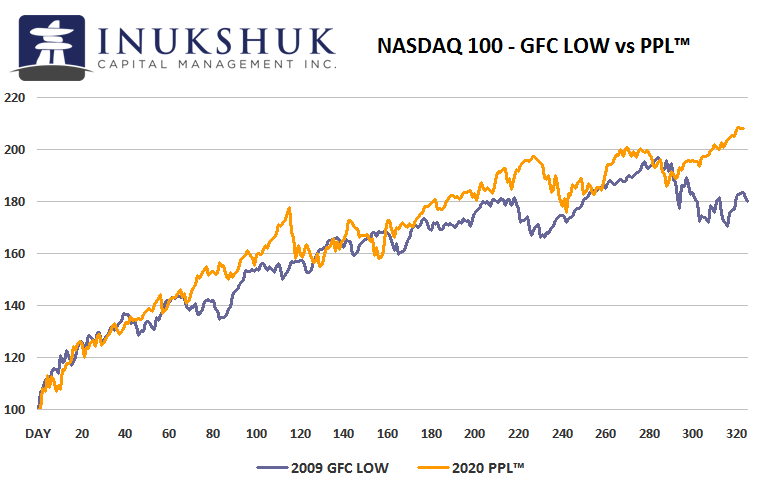 Maybe the current version of the Nasdaq 100 is a bit over its skis. Who knows, but there doesn’t seem to be anything going on that we haven’t seen before. And remember, we are currently experiencing an overwhelming global concerted monetary effort from central banks and fiscal measures to prop up demand. Valuations may be a worry, but looking simply at price, it doesn’t seem to be outside of what has been observed over the past 20-plus years. (Editors note: this section and conclusion could potentially cause the greatest tech-stock meltdown in history.)
INFLATION- ACADEMICS vs. NORMIES
So, you go to the store and that steak you want to treat yourself to would’ve been on special one year ago at $7.99 a pound is now $14.99 – maybe $12.99 on a lucky outside chance. Lettuce is $3.99 a head. And asparagus is fluctuating between $4.99 and $7.99 a pound. Seems like inflation, no?
If you are a policy maker, whether in the Ministry of Finance or advising the Bank of Canada, this is not your concern. You are most likely a trained economist. It is only personal experience when you have to fill your car with gas and buy food. From a policy perspective, the focus is on ‘core’ inflation. There is not enough time here to go into describing how that statistic is calculated, but let’s just say: it has very little to do with your day-to-day experiences. Academics make policy decisions and the normies live with them.
The ‘inflation’ global policy makers care about is not what you actually experience. So, they will act accordingly. If the now widely adopted core inflation target of central bankers is 2%, then that’s it. But asset prices have rarely been something academics consider.
To wit, paraphrased with cheeky observations: ‘the core measure of inflation we are targeting is almost at levels we consider appropriate (but a chicken costs 19 bucks) so we will continue our low-interest rate policy (despite the median house-price in Canadian cities being at record highs versus the income levels of those wishing to own one)’
Sounds legit, but markets don’t care about all of this. Millions of participants are moving money, buying and selling various things in order to make some cash or, at the very least, protect their wealth. In May and June, you could hardly avoid the inflation scare headlines. This is not to say that prices of things you need to live haven’t been punishing your budget. It is a tricky thing regarding asset prices and personal experience. Most of what you know and understand, from an emotional perspective, is useless or contrary to your best interests if you act on them in the market. Humans didn’t evolve in a way to optimize wicked trading skills.
From above, we know the S&P 500 and the S&P/TSX 60 had a good month in June. But while everyone was chattering about inflation, bonds returned twice that amount. Why would that happen?
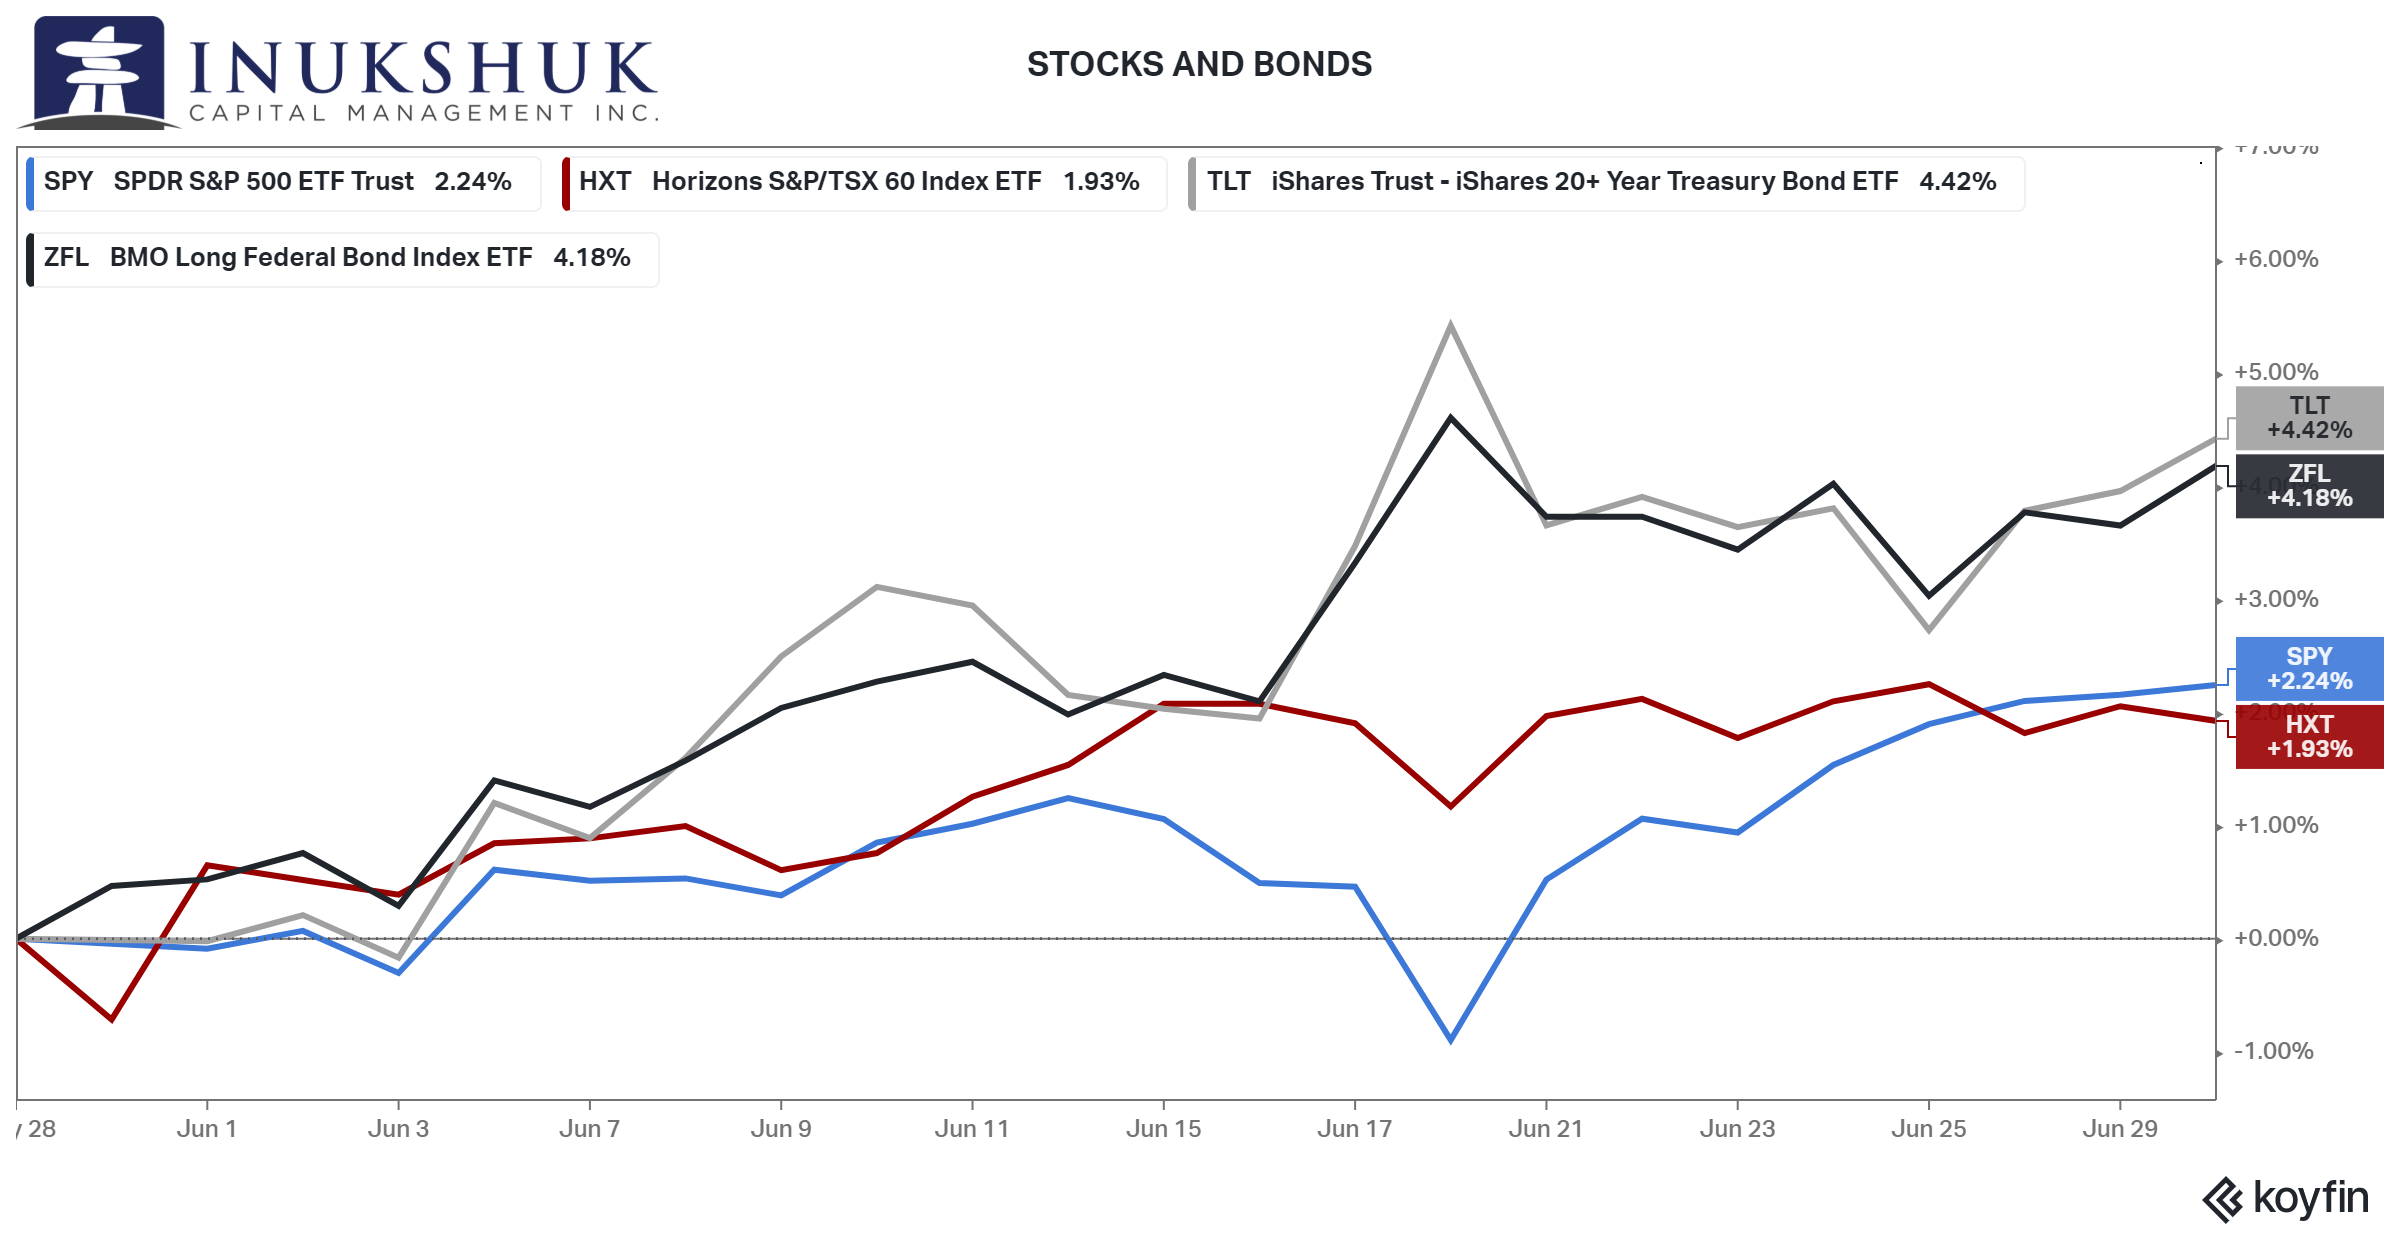
TLT is the iShares long-duration US Treasury ETF and BMO’s ZFL is its Canadian counterpart. If Mister Market was concerned about inflation, why would 30-year-long bonds yielding less than 2% rally to such a degree? If you own a 30-year Government of Canada bond that yields less than the official rate of inflation, you are losing every day. It doesn’t make sense from a logical perspective, but markets are not logical. Nobody knows nuthin.
Don’t despair, however, because it has ever been thus. Our job is to try and figure this out, while protecting our clients’ capital and earning a decent return. That is why we focus on the numbers and operate in a systematic manner.
According to Barron’s, US government bonds had the third-worst start to the year since 1830. That was published in March when TLT was down roughly 12%. In Canada, ZFL was down about the same amount but made a further new low in May, before recovering.
If you own long-bonds there is another way to make money other than clipping coupons – price appreciation. There are some interesting interrelationships between several of our equity index strategies and bond prices. In May, they were signalling that it was time to buy bonds. Considering our systems have been cautious in EAFE and EM and cash earns nothing, once the tide turned in June and ZFL broke some key levels higher, we deployed some of that money in to ZFL with very strict risk levels and what appeared to be a good potential reward if things worked out. So far so good.
There is something you learn when studying for your CFA (Chartered Financial Analyst) designation. It is called the ‘mosaic approach’. The idea is, as a securities analyst, you use all of the public information available to determine some kind of rough value of the specific security you are analyzing. This is sometimes relied upon to prove that a good analyst (there are some) is not using insider information. We use a different kind of mosaic to generate investment decisions. The above is a small sample.
The painting accompanying this note could be described as a mosaic. Cool stuff. Pretty sure the artist never got stopped out of a tragic bond trade in a panic. It seems too peaceful. Or maybe they did.
HEALTH IS WEALTH
‘To sustain it, you must maintain it.’
Victoria Bannister, ICM Health Ambassador
This month’s video features 2 stretches that you can easily do daily, before you start your day or at your desk when you need a stretch break.
At Inukshuk Capital Management, we are firm believers in the connection between Health (physical, mental and spiritual) and Wealth.
Our ICM Health Ambassador is available to our clients for complimentary consultations. Contact us for more information.
THE FUTURE OF TRAVEL
In case you missed the live event, enjoy the recording from our webinar on June 23rd. We chatted with Bruce Poon Tip, the founder of Toronto-based G Adventures, the world’s largest small-group adventure travel company. It was an enlightening and interesting conversation as Bruce shared his insights on post-pandemic travel.
What Travel Will Look Like as the World Reopens
Have a question? Contact us here.
Challenging the status quo of the Canadian investment industry.