Inukshuk Capital Management (ICM) is a multi-asset class, high-net-worth wealth management firm. We help individuals and families achieve financial longevity by tailoring solutions that integrate their unique financial planning considerations with modern wealth management approaches designed to deliver superior returns while minimizing tax and fees.
We are pleased to share our monthly newsletter which contains information on our ETF portfolios, as well as market commentary and other relevant news.
Stay up-to-date on the latest developments by following us on LinkedIn here.
APRIL 2020 – IS THE COAST CLEAR ? OUR SYSTEMS DON’T THINK SO
Once again, we hope this note finds you healthy and safe as we continue to adjust to the new realities of living with the pandemic. While it remains a challenging time, the resilience that is being shown by everyone on the front line of healthcare, essential workers and those doing their part by staying at home is remarkable.
OUR SYSTEMS SAY: ‘CAUTION’
We added a small position in Emerging Markets (EM) near the end of April, but there has been little follow-through and no confirmation from other global equity indexes. EM is usually one of the first markets to signal a change in position but, as we have observed in past notes, it is not always a reliable indicator as to what might occur with stocks globally.
While equity markets have been the most volatile on record, we have been focussed on putting our significant cash position to work. Our research and investment strategy has been directed at uncovering opportunities and value in fixed income ETFs. We are currently 65% invested in bonds with a healthy cash position, ready to be deployed. After a 35% drop, the TSX Composite has rallied 30% since the March low and as of Friday May 8, is still 15% below its highs. This simple math is why we focus on preserving capital.
If you would like to stay current on our measures of trend and momentum in the markets we follow, please click here.
THE ‘INTERNALS’
There is still stress in all markets. Last month we described our ‘looking under the hood’ with respect to credit spreads of various bonds and what that meant for the ETFs we chose to invest in. Over the past few weeks we have been ‘looking under the hood’ at the internals of the indexes that represent the market of stocks. In other words – we have been analysing what is going on with the underlying stocks themselves which comprise the components of an index.
Investors tend to describe market moves by quoting the change in a recognized index. The Dow Jones Industrial Average (the Dow), the S&P/TSX 60 and the Nasdaq100 are regularly reported. The equity ETFs we trade are benchmarked to these indexes and portfolio manager performance is usually measured against an index of some kind. Stock indexes are constructed to give an overall impression as to how the ‘market’ is performing. There are a few underlying facts that raise cause for concern regarding the health of this market of stocks.
In a research piece at the end of April, JC Parets, US technical analyst and founder of All Start Charts, highlighted a significant fact.
The Russell 3000 is comprised of 98% of all US publicly traded equities. On April 28th that index was down 18% from its high, but the median stock was down 40%. As an aside, the term for this measure is ‘drawdown’ and it is one of our favourite simple measures of risk. What this comparison in drawdown means is there are fewer stocks in that index that are strong versus many that are weak – the better performing stocks are dominating the performance of the index as a whole.
Another method for determining the breadth of a rally is to compare an equally-weighted basket of stocks to the same stocks in an index which is capitalization-weighted. The Russell 3000 is capitalization-weighted and so is the S&P 500. That means as successful companies increase in value relative to others, their performance can come to dominate the performance of an index. This isn’t a critique of any one index construction technique. It’s a comparison of two different styles of index using the same companies. This is not a new phenomenon. In the 1960s and early 1970s the ‘Nifty Fifty’ dominated the performance of the market. These were the ‘one-decision’ blue chip stocks you ‘had’ to own.
Today, it is much more highly concentrated. In early April, David Rosenberg, founder of Rosenberg Research and Associates, highlighted that four stocks – Amazon, Netflix, Google and Facebook – were a 35% share of the S&P 500. Last week, Rosenberg noted that the S&P 500 has “rarely been so concentrated” and the ratio of the equal-weight index to the headline capitalization-weighted index was in “sharp decline”.
Both of these facts reinforce one of our primary tenets of investing: most stock pickers do not beat the index so why pay them excess fees to try. The evidence of this should present itself in actual portfolio manager performance.
Let’s look at one of the best stock pickers, Warren Buffet. Last quarter Berkshire Hathaway lost 50 billion dollars and experienced its worst relative performance to the S&P 500 in many years. According to Bespoke Investment Group, in a letter published last week, Buffet has not underperformed the S&P 500 this much since the dot com bubble. Except this time, stocks were going down. As of Friday the stock, BRKA is 23% off its highs while at the same time the S&P 500 is down 14%. Neither of those results is good, but the idea behind Buffet’s investment thesis is that by selective investment in the equity of quality companies, they will be able to better weather the inevitable storms. This is only a single quarter. But it is an historic one and instead of using this opportunity to ‘buy stocks at a discount’ Buffet has not bought anything and actually raised cash by selling his airline holdings.
THE COMPANY THIS RALLY KEEPS
A common headline or talking point in financial media is how this day or week or month compares to past market sell-offs or rallies. We have published charts of this year’s crash versus how the ‘Great Financial Crisis’ (GFC) evolved from 2008 to the ‘generational’ low of March 2009. It is regularly updated here. This is not a basis of analysis for investment decisions but an interesting thought-exercise. It is important to note, many of the worst and best moves over days/weeks/months tend to cluster together.
For example, April was the best month for the Dow since 1987. In 1987 the Dow made an all time high in August and didn’t surpass that high until January 1992. Or take a recent CNBC headline: ‘Dow rallies more than 1,300 points, capping its biggest 3-day surge since 1931’ – we know what happened after that – the Great Depression, and a further fall in the Dow of 60%. And also from CNBC on April 28: ‘Stocks jump 2%, putting the S&P 500 on track for its best month since 1974’. After 1974, the Dow fell more than 50% and didn’t get back to 1974 levels until… 1987.
OTHER MARKETS, CENTRAL BANKS AND THE DOLLAR
There is not yet a negative interest rate policy under official consideration by the Federal Reserve, but their asset buying program has been in overdrive. At the beginning of the year the Fed’s balance sheet was $4.1 trillion. In 2007, just before the GFC, this number was close to $900 billion. At the end of last month it had expanded to over $6.5 trillion. To put this in context, the GDP of the US is around $21 trillion. On Monday, the US Treasury announced it will have to sell almost $3 trillion in bonds to fund government operations over the next quarter, most of which is to finance fiscal support due to the lockdown. Despite claims to the contrary, the Federal Reserve is now in the business of monetizing debt.
Apparently, the Fed’s ETF buying program announced in March will start rolling out this week. For historical context, the Bank of Japan (BoJ) implemented an ETF buying program in 2010 once it realized various quantitative easing programs were not accomplishing stated goals. According to recent statistics released by the BoJ and the Japan Exchange Group, it now owns 5.5% of all equity in Japan. This share could rise to 7.5% by the end of the year if the new targets announced in March, to double the rate of purchases, are achieved.
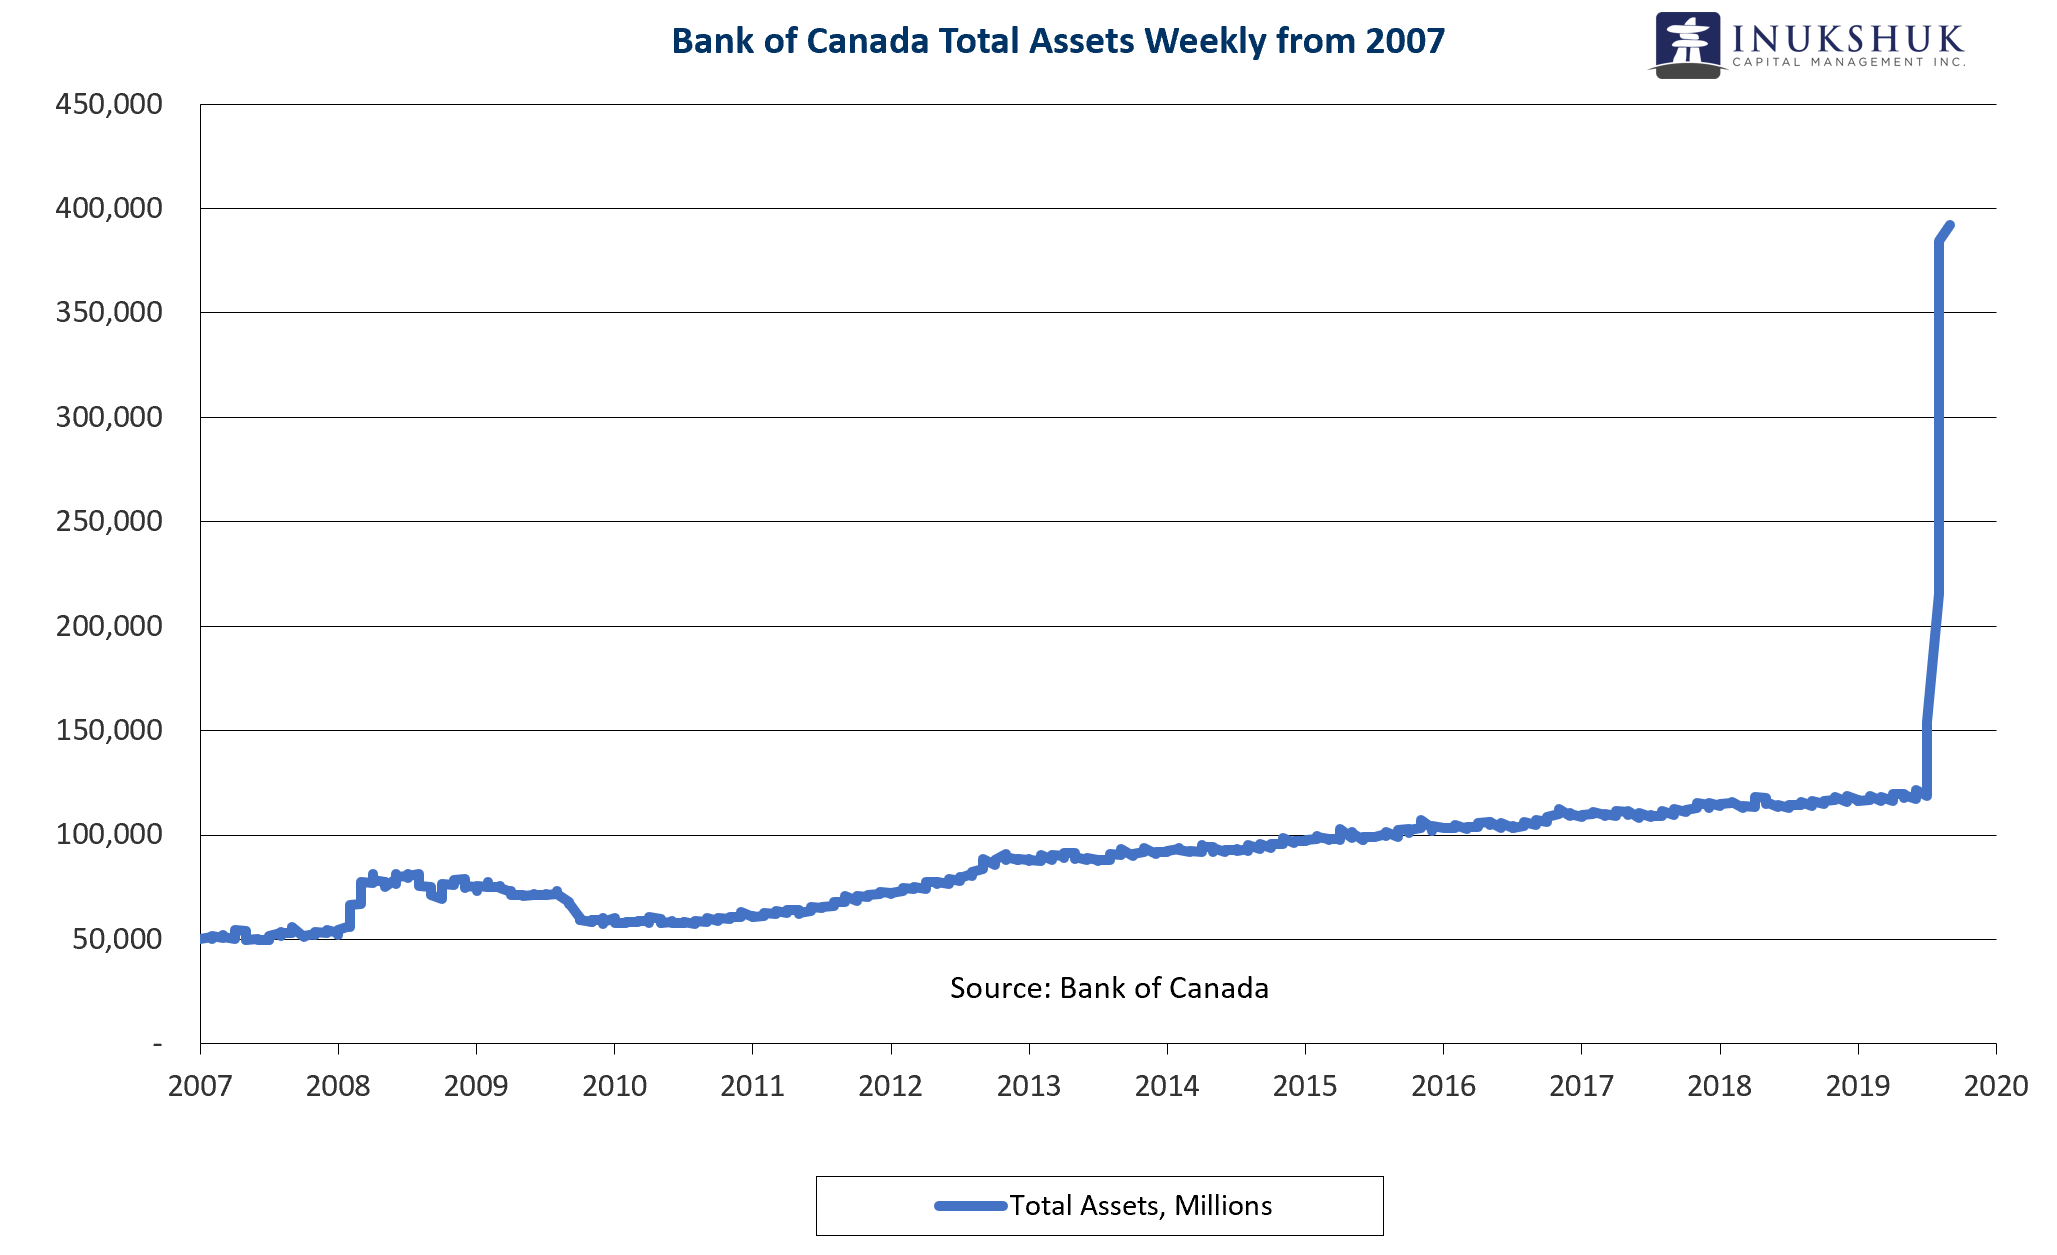
The Bank of Canada (the Bank) is doing its best to keep up with ‘Team Central Bank’. On March 11, the Bank published asset holdings of $120 billion. Last Wednesday that number was $392 billion. What this means is, over 7 weeks its operations have purchased $272 billion in mortgage, provincial and government of Canada bonds, as well as other money market and fixed income securities.
In other strange news, the USD/CAD exchange rate has been hovering around 1.4000 for the past month as the foreign exchange market tries to determine which central bank has lost the plot more so than any other. This means the Loonie is worth around 71.5 cents. The range to watch is 1.3700 to 1.4700, but the odds seem to favour higher.
Have a question? Contact us here.
Inukshuk Capital Management actively manages equity risk through our proprietary strategies which have shown to significantly reduce drawdowns, while outperforming their benchmarks over time.